

Click here to download this post
By Dr. Nicholas L. DePace, M..D., F.A.C.C – Cardiologist specializing in autonomic dysfunction, Ehlers-Danlos syndrome and POTS.
ME/CFS is a heterogeneous group of patients. Recent studies [1, 2, 3, 4, 5] suggest triggering insults such as infections can cause autoantibodies and oxidative stress to dysregulate cellular and specifically mitochondrial energetics, both of which may lead to exercise intolerance. Other common symptoms of ME/CFS may be due to (1) disturbed gut microbiota possibly leading to “leaky-gut” or other GI consequences [6, 7, 8]; (2) microglial activation and inflammation of the nervous system, including the central nervous system, possibly leading to chronic pain due to allodynia and hyperalgesia [9, 10, 11, 12, 13, 14, 15, 16] (see the two figures from [13]); (3) neuronal inflammation is important in the pathophysiology of creating many disabling symptoms; (4) high levels of pro-inflammatory cytokines and low levels of antioxidants, such as CoQ10 or Glutathione, have been reported [17]; or (5) abnormalities of the Hypothalamus-Pituitary-Adrenal Axis possibly leading to “delayed cortisol awakening” [18, 19, 20] possibly leading to unrefreshing sleep. We recommend ALA because Glutathione does not penetrate into the Mitochondria whereas ALA does and helps to recycle Glutathione, along with many other benefits.
Myhill and coworkers [21] used an Adenosine Triphosphate (ATP) profile test (see Appendix) in neutrophils to establish mitochondrial dysfunction in ME/CSF patients. They concluded “our observations strongly implicate mitochondrial dysfunction as the immediate cause of CFS symptoms (see Figure from [21]). However, we cannot tell whether the damage to mitochondrial function is a primary effect or secondary effect to one or more of a number of comorbidities, for example, cellular hypoxia or oxidative stress, including excessive peroxynitrates.” A familial aggregation of ME/CFS has been noted [22]. Metabolic differences in ME/CFS patients demonstrate inability of CFS Peripheral Blood Mononuclear Cells (PBMCS) to fulfill cellular energetic demands both under basal conditions and when Mitochondria are stresses during periods of high metabolic demand such as hypoglycemia [20].
The concurrence of similar autoantibodies in patients with POTS [21] (which may be comorbid with Vasovagal Syncope) and ME/CFS (particularly muscarinic and adrenergic receptor abnormalities) [17, ] is more than coincidental. Parasympathetic and Sympathetic dysfunction and ME/CFS are apparently “joined at the hip.” Ehlers-Danlos Syndrome (EDS) and Hypermobile patients may have a genetic predisposition to autoimmunity and mitochondrial dysfunction. Many of these patients also manifest autonomic (P&S) dysfunction and ME/CFS. POTS, EDS and ME/CFS all have significant fatigue as a common symptom with a “dynamic” Parasympathetic Excess (PE) as a common dysautonomia. PE is central to Vasovagal Syncope [24]. Many of the symptoms of EDS or Hypermobility are due to “leaky” connective tissue which causes an excessively active immune system, which is associated with PE since the Parasympathetics control the immune system. We also find that PE is significantly associated with ME/CFS [24]. The adrenergic abnormalities may be explained by PE, including excessive adrenergic or Sympathetic activity. With PE, Sympathetic Excess is secondary, due to the Sympathetic response being abnormally amplified by the Parasympathetic increase (rather than the decrease that is expected to happen normally) [24]. In fact we believe, the autoimmunity to also be associated with PE. PE causes an overactive immune system, which in more normal patients may lead to autoimmunity. PE mediated autoimmunity results from the immune system being excessively active, and having exhausted any invading entities, turns on the host. We have seen that relieving PE has relieved some autoimmune symptoms [personal observation].
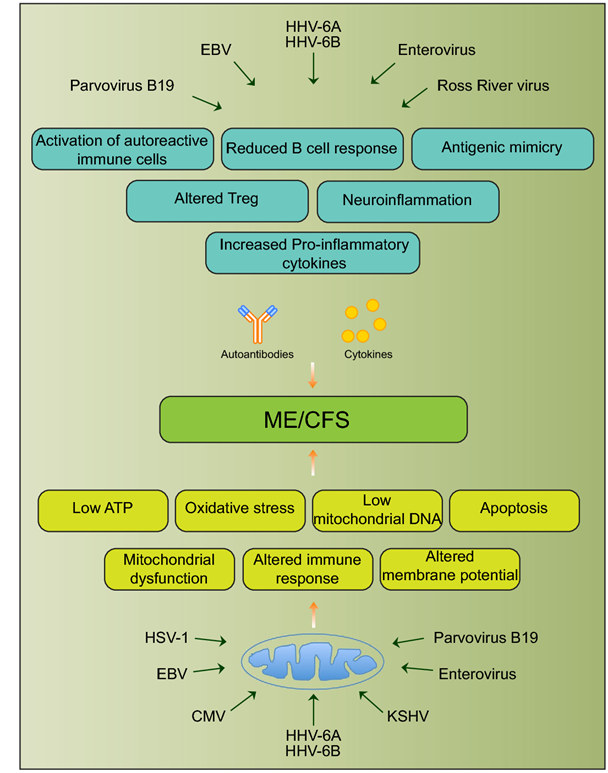
Fig. 1 Schematic diagram showing various viral pathogens potentially associated with ME/CFS and possible molecular mechanisms altered by these pathogens that can contribute to ME/CFS development [25]
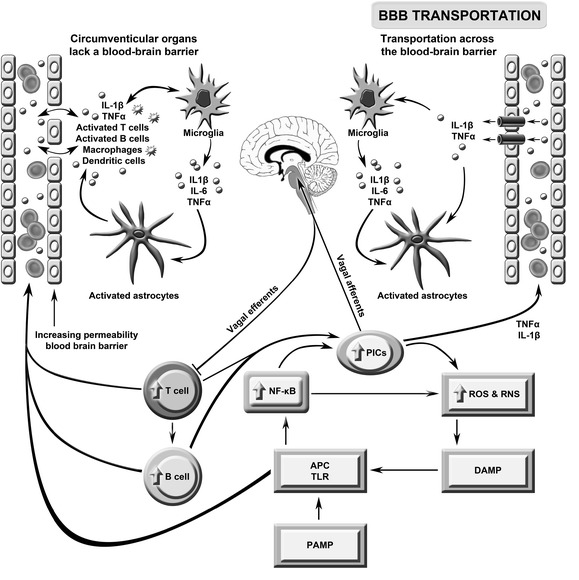
This figure describes the putative role of immune brain communication in the pathogenesis of severe intractable fatigue. Toll-like receptors (TLRs) on antigen presentation cells (APCs) may be activated by pathogen- or damage-associated molecular patterns (PAMPs/DAMPs) leading to the activation of nuclear factor-κB (NF-κB) and the subsequent upregulation of pro-inflammatory cytokines (PICs), including interleukin (IL)-1β, IL-6 and tumor necrosis factor (TNF)-α, and reactive oxygen and nitrogen species (ROS/RNS). These radical species may further damage macromolecules, increasing levels of redox-derived DAMPs which further engage TLRs in a self-sustaining cycle. PIC signals reach the brain via the afferent arm of the vagus nerve, engagement with transporters in the blood brain barrier (BBB) and passive diffusion. Inflammatory signaling from the periphery activates microglia which produce a range of neurotoxic molecules activating astrocytes causing a loss of brain homoeostasis and disruption of the BBB. The latter allows abnormally high numbers of activated T and B cells and macrophages to circulate between the periphery and the brain. This figure is original. [26]

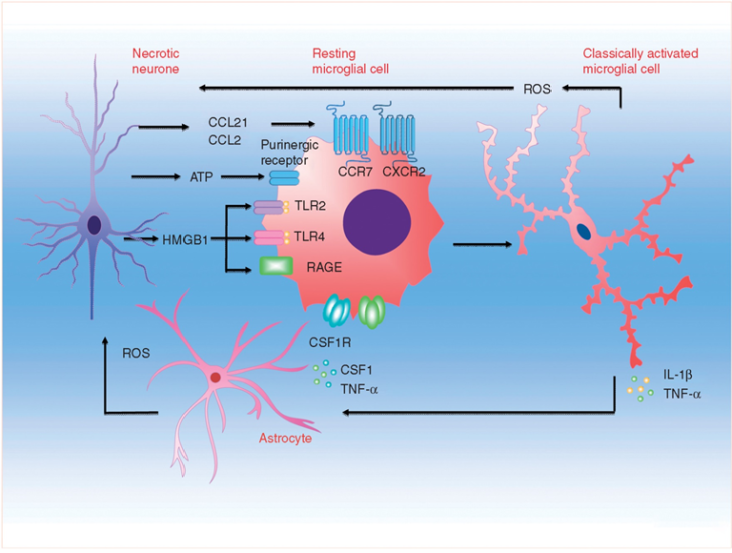
Activation of microglia after peripheral nerve injury. Microgliosis in the spinal cord is coordinated by sensory afferent derived injury signals, whereby chemokines, nucleotides, and other pro-inflammatory mediators released from damaged afferent terminals could signal through post-synaptic surface receptors to activate microglia. Preclinical studies showed spinal nerve injury could lead to sustained neuronal upregulation and/or increased synaptic release of neuregulin-1, matrix metalloproteases, chemokine (C-C motif) ligand 2, fractalkine and its cognate receptor CXCR3. Release of danger/damage-associated molecular patterns (DAMPs), intracellular nucleotides or proteins that become highly immunogenic when liberated into extracellular space, could also occur in primary afferent injury. In particular, ATP signalling through ionotropic purinergic receptor (P2X4R and P2X7R) was shown to contribute to microglial activation and inflammatory cytokine release. Activation of microglial pattern recognition receptors (PRRs), for example toll-like receptors (TLR2 and TLR4) and receptor for advanced glycation end products (RAGE), by afferent-derived DAMP mediator high mobility group box protein 1 (HMGB1), represents another microglial activation pathway. Activated microglia will in turn release pro-inflammatory cytokines (TNF-α, IL-1β and IL-6), colony-stimulating factor 1 (CSF1), brain-derived neurotropic factor (BDNF), reactive oxygen species (ROS) among others into the spinal cord micro-environments, to direct multidirectional crosstalk between primary afferent, interneurons, secondary neurones, astrocytes and microglia. [13]
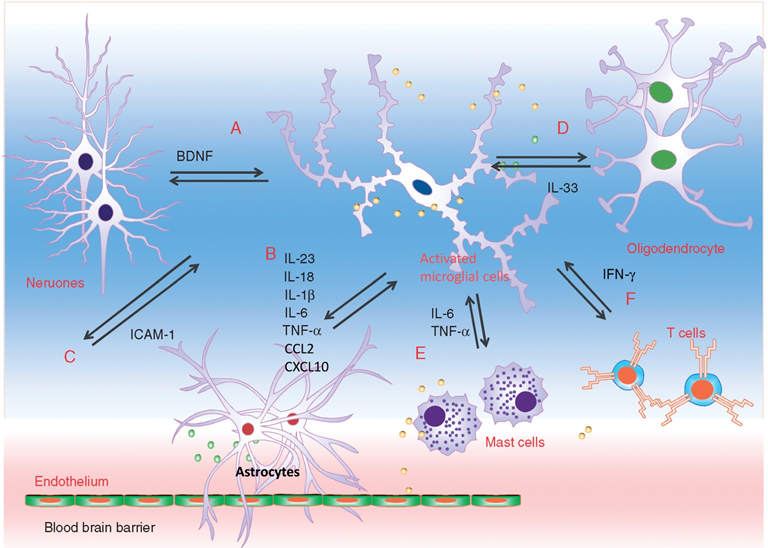
Interaction between microglia and other cell types during neuropathic pain. Microglia engage in extensive neuronal and immune cell crosstalk during neuropathic nociceptive transmission. (A). ATP-stimulated brain derived neurotrophic factor (BDNF) release from microglia was shown to depolarise nociceptive neurones in spinal cord, by inverting the polarising current from GABA-A receptor. (B). Microglia-astrocyte interaction was also evident during sensory nerve injury. IL-18 (also IL-1β) release from activated microglia likely signals through IL18R on astrocytes, together with increased chemokine CX3CL1-CX3C1R interaction between microglia and astrocyte, activates NF-kB pathway in astrocytes to upregulate the expression of pro-inflammatory cytokines. Astrocyte-derived interleukin-1β and interleukin-23 are thought to promote allodynia/behavioural sensitisation from nociceptive stimulation, by modulating NMDA receptor activities on post-synaptic neurones. (C) Activated microglia could also stimulate the endothelial expression of intracellular adhesion molecule 1 (ICAM1) from peripheral inflammatory pain stimulation, to alter the permeability of blood-brain barrier. (D) Sensory nerve injury also stimulated the spinal oligodendrocytes to release interleukin-33/alarmin, which targets the microglia and astrocytes to promote IL-1β and TNF-α release. (E) Microglia-mast cell interaction may also contribute to neuropathic pain. In peripheral nerves, resident mast cell degranulation could sensitise/activate nociceptors, likely through the action of histamine, to result in neuropathic pain. Mast cells are also located in the spinal cord, and upon activation, the release of mast cell tryptase could directly activate microglia through protease-activated receptor 2 (PAR2), upregulating the synthesis of pro-nociceptive TNF-a and interleukin-6. (F) CD4+ T-lymphocytes infiltrate the dorsal spinal horn after sensory nerve injury to contribute to spinal microglia activation, through the release of interferon-γ, to mediate tactile allodynia. [13]

Main stages and location of energy metabolism in a human cell (left), and simplified details of a mitochondrion showing the main metabolic cycles and the oxidative phosphorylation respiratory chain (right). The outer mitochondrial membrane is highly permeable whereas the inner membrane is permeable only to water and gases. Special carrier and Translocator proteins pass reactants through it. At the top are the proteins involved in the respiratory electron transfer chain (ETC) and in the transfer of ATP and ADP between the cytosol and mitochondrion. ADP and Pi are combined by ATP synthase to make ATP. The ADP/ATP Translocator opens OUT to transfer ADP into the matrix and opens IN to transfer ATP to the cytosol. Nicotinamide adenine dinucleotide plays a key role in its oxidized form NAD+ and its reduced form NADH + H+ in carrying and transferring protons (H+) and electrons (e−) [21].
APPENDIX: THE “ATP PROFILE” TEST
The “ATP profile” test yields 5 independent numerical factors from 3 series of measurements, (A), (B), and (C) on blood samples (neutrophils). The 3 series are:
- ATP concentration in the neutrophils is measured in the presence of excess magnesium which is needed for ATP reactions. This gives the factor ATP in units of nmol per million cells (or fmol/cell), the measure of how much ATP is present. Then a second measurement is made with just endogenous magnesium present. The ratio of this to the one with excess magnesium is the ATP Ratio. This tells us what fraction of the ATP is available for energy supply.
- The efficiency of the oxidative phosphorylation process is measured by first inhibiting the ADP to ATP conversion in the laboratory with sodium azide. This chemical inhibits both the mitochondrial protein cytochrome a3 (last step in the ETC) and ATP synthase [50]. ATP should then be rapidly used up and have a low measured concentration. Next, the inhibitor is removed by washing and re-suspending the cells in a buffer solution. The mitochondria should then rapidly replete the ATP from ADP and restore the ATP concentration. The overall result gives Ox Phos, which is the ADP to ATP recycling efficiency that makes more energy available as needed.
- The TL switches a single binding site between two states. In the first state ADP is recovered from the cytosol for re-conversion to ATP, and in the second state ATP produced in the mitochondria is passed into the cytosol to release its energy. Measurements are made by trapping the mitochondria on an affinity chromatography medium. First the mitochondrial ATP is measured. Next, an ADP-containing buffer is added at a pH that strongly biases the TL towards scavenging ADP for conversion to ATP. After 10 minutes the ATP in the mitochondria is measured. This yields the number TL OUT. This is a measure of the efficiency for transfer of ADP out of the cytosol for reconversion to ATP in the mitochondria. In the next measurement a buffer is added at a pH that strongly biases the TL in the direction to return ATP to the cytosol. After 10 minutes the mitochondria are washed free of the buffer and the ATP remaining in the mitochondria is measured and this gives the number TL IN. This is a measure of the efficiency for the transfer of ATP from the mitochondria into the cytosol where it can release its energy as needed.
DETAILS
The “ATP profile” tests were developed and carried out at the Biolab Medical Unit, London, UK (www.biolab.co.uk), where one of us (JMH) was Laboratory Director until retirement in 2007. Blood samples in 3-ml heparin tubes were normally received, tested and processed within 72 hours of venepuncture. We briefly describe here the 3 series of measurements, (A), (B) and (C) and how the 5 numerical factors are calculated. (Step-by-step details can be obtained by contacting JMH at acumenlab@hotmail.co.uk).
Neutrophil cells are separated by HistopaqueTM density gradient centrifugation according to Sigma® Procedure No. 1119 (1119.pdf available at www.sigmaaldrich.com). Cell purity is checked using optical microscopy and cell concentration is assessed using an automated cell counter. Quantitative bioluminescent measurement of ATP is made using the Sigma® Adenosine 5’-triphosphate (ATP) Bioluminescent Somatic Cell Assay Kit (FLASC) according to the Sigma® Technical Bulletin No. BSCA-1 (FLASCBUL.pdf). In this method ATP is consumed and light is emitted when firefly luciferase catalyses the oxidation of D-luciferin. The light emitted is proportional to the ATP present, and is measured with a Perkin-Elmer LS 5B Fluorescence Spectrometer equipped with a flow-through micro cell. Sigma® ATP Standard (FLAA.pdf) is used as a control and as an addition-standard for checking recovery. Similar kits are available from other providers, e.g. the ENLITENTM ATP Assay System (Technical Bulletin at www.promega.com), and dedicated instruments are now available, e.g. Modulus Luminescence Modules (see Application Note www.turnerbiosystems.com/doc/appnotes /PDF/997_9304.pdf).
- ATP is first measured with excess magnesium added via Sigma® ATP Assay Mix giving result a. This is the first factor, the concentration of ATP in whole cells, ATP = a in units of nmol/106 cells (or fmol/cell).
The measurement is repeated with just the endogenous magnesium present by using analogous reagents produced in-house without added magnesium, giving result b in the same units. The ratio, c = b/a, is the second factor, the ATP Ratio. - In order to measure the ADP to ATP conversion efficiency via the ox-phos process, the ATP (with excess magnesium) result, a, is used and then the conversion is inhibited in the laboratory with sodium azide for 3 min and result d is obtained (also with excess magnesium). The laboratory inhibitor is then removed by washing with buffered saline and the mitochondria should rapidly replete (again 3 min) the ATP supply from ADP. This gives result e in the same units. The conversion efficiency Ox Phos is
f = [(e – d) / (a – d)].
(C). In order to measure the effectiveness of the Translocator (TL) in the mitochondrial membrane the cells are ruptured and the mitochondria are trapped onto pellets of an affinity chromatography medium doped with a low concentration of atractyloside. This immobilises the mitochondria while the other cell components are washed away. The buffers used then free the mitochondria leaving the atractyloside on the solid support that plays no further part in the method. The mitochondrial ATP concentration is measured giving result g in units of pmol/million cells. For the next measurement some pellets are immersed in a buffer (which acts as an artificial cytosol) containing ADP at pH = (5.5 ± 0.2) which biases the TL towards scavenging ADP to be converted to ATP in the mitochondria. After 10 min the ATP is measured again, giving result h in the same units. The factor TL OUT is the fractional increase in ATP:
j = [(h – g) / g].
For the next measurement pellets are immersed in a buffer not containing ADP and the TL is biased away from ADP pickup and towards ATP transfer into the artificial cytosol at pH = (8.9 ± 0.2) After 10 min the mitochondrial ATP is again measured giving result k, and the factor TL IN is the fractional decrease:
l = [(g – k) / g].
For more information visit our autonomic dysfunction center.
About the Author
Nicholas L. DePace, MD, FACC is a board-certified cardiologist and Medical Director of Franklin Cardiovascular Associates. A graduate of the Mount Sinai School of Medicine, Dr. DePace has decades of clinical, academic, and research experience and has held faculty appointments as a Clinical Professor of Medicine, becoming one of the youngest full professors in Philadelphia at the time of his appointment.
Dr. DePace specializes in the diagnosis and treatment of autonomic nervous system dysfunction (dysautonomia), including POTS, autonomic dysfunction associated with Ehlers-Danlos syndrome (EDS), chronic fatigue, and anxiety-like conditions that are frequently misdiagnosed. He is nationally recognized for his work on parasympathetic and sympathetic (P&S) nervous system imbalance, a core mechanism underlying many complex chronic disorders.
In addition to treating patients from across the United States, Dr. DePace is a prolific clinical researcher and author of multiple nationally distributed medical textbooks published by Springer and W.W. Norton, focusing on autonomic dysfunction, mitochondrial disorders, cardiovascular disease, and mind–body medicine.
 View Dr. DePace’s professional profile View medical books by Dr. DePace
REFERENCES
[1] Anand, S.K.; Tikoo, S.K. Viruses as modulators of mitochondrial functions. Adv. Virol. 2013, 2013, 1–17 doi: 10.1155/2013/738794.
[2] Fenouillet E, Vigouroux A, Steinberg JG, Chagvardieff A, Retornaz F, Guieu R, Jammes Y. Association of biomarkers with health-related quality of life and history of stressors in myalgic encephalomyelitis/chronic fatigue syndrome patients. J Transl Med. 2016 Aug 31; 14(1):251. doi: 10.1186/s12967-016-1010-x.
[3] Komaroff, A.L. Inflammation correlates with symptoms in chronic fatigue syndrome. Proc. Natl. Acad. Sci.
USA 2017, 114, 8914–8916 doi: 10.1073/pnas.1712475114.
[4] Blomberg J, Gottfries CG, Elfaitouri A, Rizwan M, Rosén, A. Infection elicited autoimmunity and Myalgic encephalomyelitis/chronic fatigue syndrome: An explanatory model. Front. Immunol. 2018, 9, 229 doi 10.3389/fimmu.2018.00229.
[5] Behan WM, More IA, Behan PO. Mitochondrial abnormalities in the postviral fatigue syndrome. Acta Neuropathol. 1991; 83(1): 61-5.
[6] Nagy-Szakal D, Williams BL, Mishra N, Che X, Lee B, Bateman L, Klimas NG, Komaroff AL, Levine S, Montoya JG, Peterson DL, Ramanan D, Jain K, Eddy ML, Hornig M, Lipkin WI. Fecal metagenomic profiles in subgroups of patients with myalgic encephalomyelitis/chronic fatigue syndrome. Microbiome. 2017 Apr 26;5(1):44. doi: 10.1186/s40168-017-0261-y.
[7] Maes M, Twisk FN, Kubera M, Ringel K, Leunis JC, Geffard M. Increased IgA responses to the LPS of commensal bacteria is associated with inflammation and activation of cell-mediated immunity in chronic fatigue syndrome. J Affect Disord. 2012 Feb;136(3):909-17. doi: 10.1016/j.jad.2011.09.010.
[8] Giloteaux L, Goodrich JK, Walters WA. et al. Reduced diversity and altered composition of the gut microbiome in individuals with myalgic encephalomyelitis/chronic fatigue syndrome. Microbiome. 2016; 4: 30. doi:10.1186/s40168-016-0171-4.
[9] Glassford JAG. The neuroinflammatory etiopathology of myalgic encephalomyelitis/chronic fatigue syndrome (ME/CFS). Front. Physiol. 2017, 8, 1–9. Doi: 10.3389/fphys.2017.00088.
[10] Nakatomi Y, Mizuno K, Ishii A, Wada Y, Tanaka M, Tazawa S, Onoe K, Fukuda S, Kawabe J, Takahashi K, et al. Neuroinflammation in Patients with Chronic Fatigue Syndrome/Myalgic Encephalomyelitis: An 11C-(R)-PK11195 PET Study. J. Nucl. Med. 2014, 55, 945–950. doi: 10.2967/jnumed.113.131045.
[11] Ji RR, Berta T, Nedergaard M. Glia and pain: is chronic pain a gliopathy? Pain. 2013 Dec;154 Suppl 1(0 1):S10-28. doi: 10.1016/j.pain.2013.06.022..
[12] Ren K, Dubner R. Neuron-glia crosstalk gets serious: role in pain hypersensitivity. Curr Opin Anaesthesiol. 2008 Oct;21(5):570-9. doi: 10.1097/ACO.0b013e32830edbdf.
[13] Zhao H, Alam A, Chen Q, A Eusman M, Pal A, Eguchi S, Wu L, Ma D. The role of microglia in the pathobiology of neuropathic pain development: what do we know? Br J Anaesth. 2017 Apr 1;118(4):504-516. doi: 10.1093/bja/aex006.
[14] Ricci, G., Volpi, L., Pasquali, L. et al. Astrocyte–neuron interactions in neurological disorders. J Biol Phys. 2009; 35: 317–336. doi:10.1007/s10867-009-9157-9
[15] Puri BK, Jakeman PM, Agour M, Gunatilake KDR, Fernando KAC, Gurusinghe AI, Treasaden IH, Waldman AD, and Gishen P. Regional grey and white matter volumetric changes in myalgic encephalomyelitis (chronic fatigue syndrome): a voxel-based morphometry 3 T MRI study. B J Radiol. 2012; 85:1015, e270-e273. doi: 10.1259/bjr/93889091.
[16] Meeus, M., Nijs, J. Central sensitization: a biopsychosocial explanation for chronic widespread pain in patients with fibromyalgia and chronic fatigue syndrome. Clin Rheumatol. 2007; 26: 465–473. doi:10.1007/s10067-006-0433-9
[17] Maes M, Mihaylova I, Kubera M. et al. IgM-mediated autoimmune responses directed against anchorage epitopes are greater in Myalgic Encephalomyelitis/Chronic Fatigue Syndrome (ME/CFS) than in major depression. Metab Brain Dis. 2012; 27: 415–423. doi:10.1007/s11011-012-9316-8.
[18] Hall DL, Lattie EG, Antoni MH, et al. Stress management skills, cortisol awakening response, and post-exertional malaise in Chronic Fatigue Syndrome. Psychoneuroendocrinology. 2014;49:26–31. doi:10.1016/j.psyneuen.2014.06.021.
[19] Nijhof SL, Rutten JM, Uiterwaal CS, Bleijenberg G, Kimpen JL, Putte EM. The role of hypocortisolism in chronic fatigue syndrome. Psychoneuroendocrinology. 2014 Apr;42:199-206. doi: 10.1016/j.psyneuen.2014.01.017.
[20] Tomas C, Brown A, Strassheim V, Elson J, Newton J, Manning P (2017) Cellular bioenergetics is impaired in patients with chronic fatigue syndrome. PLoS ONE 2017; 12(10): e0186802. 10.1371/journal.pone.0186802.
[21] Myhill S, Booth NE, McLaren-Howard J. Chronic fatigue syndrome and mitochondrial dysfunction. Int J Clin Exp Med. 2009; 2(1): 1–16.
[22] Buchwald D, Herrell R, Ashton S, Belcourt M, Schmaling K, Sullivan P, Neale M, Goldberg J. A twin study of chronic fatigue. Psychosom Med. 2001 Nov-Dec;63(6):936-43.
[23] Reynolds, GK, Lewis, DP, Richardson, AM, Lidbury, BA The John Curtin School of Medical Research, The Australian National University, Canberra; Donvale Medical Centre, Donvale, Victoria; and Faculty of Education, Science, Technology and Mathematics, The University of Canberra, Canberra, Australia. Comorbidity of postural orthostatic tachycardia syndromeand chronic fatigue syndrome in an Australian cohort. J Intern Med. 2014; 275: 409– 417. doi: 10.1111/joim.12161
[24] Colombo J, Arora RR, DePace NL, Vinik AI. Clinical Autonomic Dysfunction: Measurement, Indications, Therapies, and Outcomes. Springer Science + Business Media, New York, NY, 2014.
[25] Rasa S, Nora-Krukle Z, Henning N, Eliassen E, Shikova E, Harrer T, Scheibenbogen C, Murovska M, and Prusty BK. Chronic viral infections in myalgic encephalomyelitis/chronic fatigue syndrome (ME/CFS). J Translational Med. 2018; 16: 268, doi:10.1186/s12967-018-1644-y.
[26] Morris G, Berk M, Walder K, Maes M. Central pathways causing fatigue in neuro-inflammatory and autoimmune illnesses. BMC Med. 2015; 13: 28. doi:10.1186/s12916-014-0259-2.